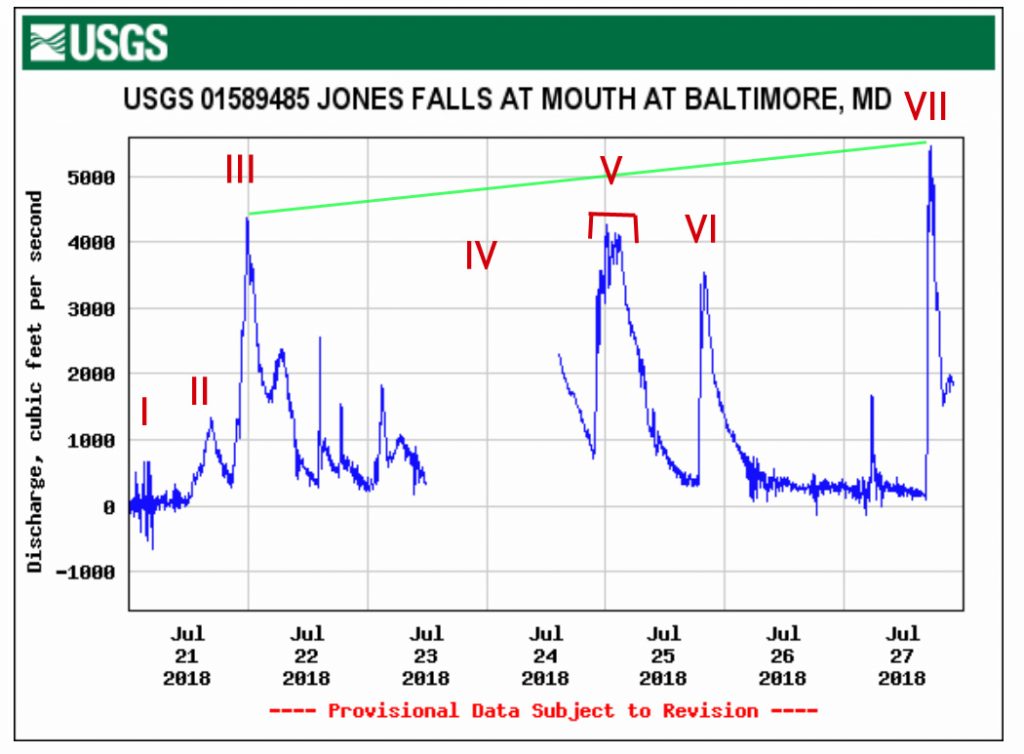
A brief mention on the monitoring of the behavior the Jones Falls River and respective Conduit surge events.
still waiting for https://www.ncdc.noaa.gov/ to post the precipitation data. Oddly this week is missing but perhaps the data requires validation.
Sadly this specific sensor has loss funding and will be shut down October 2018. Fortunately funding for this sensor was renewed.
I: This pre-surge oscillation is interesting and do not believe it to be artifact.
II: Initial downpour, we see a typical 1200 cu/ft bump up. The systems new load should of been short lived as it return to base line . <200 cu/ft sec daily flow was see all through June until July 20, 2018. 2018.
III: A massive 4300 cu/ft sec surge, fueled by a sudden downpour near 1200hr. The upper valley was certainly still draining residuals, however the surge/wave event is apparent.
Also see the 2400 cu/ft sec bump up just after the 4300 cu/ft sec surge. Almost like a wave? Is this a surge coming from the 1200hr downpours in the upper portion of the valley catching up?
IV: Missing section was all riddled with artifact. All this discharge volume must of wrecked havoc on the sensor.
V: Whats interesting about this particular surge is see how “fat” that peak is. The surge really held its discharge volume. sustained discharge of 4000 cu/ft sec.
VI: Another sizable surge. System is almost like oscillating with these daily downpours.
VII: I believe that the over all systems load led to this mother of all surges (Note: exponential curve green line). Look how sharp that spike is, there is no doubt, it must of came through as a wave.
Velocity was in congruence with the surges and worth to compare.


